Price (USD)
Kandypens Oculus edgeDr. Dabber Boost Evo
$240
Kandypens Oculus
$100
Kandypens Oculus is typically around $140 lower.
Vaporizer Comparison
Side-by-side specs, pricing context, and clear decision guidance.
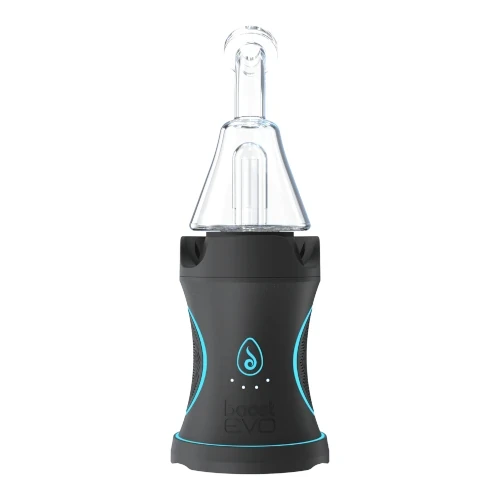
Dr. Dabber Boost Evo
Dr. Dabber from $417.99
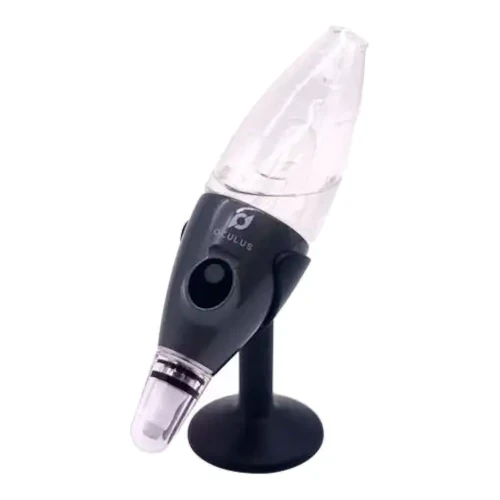
Kandypens Oculus
Kandypens $100
Dr. Dabber Boost Evo and Kandypens Oculus are both concentrates / conduction vaporizers, but they target different priorities. Kandypens Oculus is usually the lower-cost pick at $100, around $140 below Dr. Dabber Boost Evo. Session style, airflow, and extraction behavior will matter more than raw spec sheet numbers here.
Specs Compared
24
Different Specs
20
Shared Specs
4
Overall Overlap
17%
Shared Traits
A quick snapshot of the specs people usually care about first.
Dr. Dabber Boost Evo
$240
Kandypens Oculus
$100
Kandypens Oculus is typically around $140 lower.
Dr. Dabber Boost Evo
Conduction
Kandypens Oculus
Conduction
Both devices use a similar heating approach.
Top specs where these two devices diverge.
Price (USD)
Dr. Dabber Boost Evo
$240
Kandypens Oculus
$100
Device Type
Dr. Dabber Boost Evo
Desktop
Kandypens Oculus
Portable
Power Adjustment
Dr. Dabber Boost Evo
Modular - Six Stages
Kandypens Oculus
3 Preset Voltage Settings
Brand
Dr. Dabber Boost Evo
Dr. Dabber
Kandypens Oculus
Kandypens
Warranty
Dr. Dabber Boost Evo
1 year
Kandypens Oculus
Lifetime (battery)
Current price
$417.99
at Mind Vapes
Typical price
$100
No stores listed yet
Prices are read automatically from retailer pages and were last checked Oct 9, 2026; confirm the price at checkout. Some links are affiliate links, which support Thermal Extractions at no extra cost to you.
Direct comparison of every spec from each device profile.
| Specification | Dr. Dabber Boost Evo | Kandypens Oculus |
|---|---|---|
| Price (USD) | $240 | $100 |
| Device Type | Desktop | Portable |
| Heating Type | Conduction | Conduction |
| Heat Up Time | ~11 Seconds | — |
| Temperature Range | 500-750°F | — |
| Chamber Capacity | — | N/A |
| Battery Type | Internal | Internal |
| Battery Capacity | — | 500mAh |
| Battery Life | 40-60 heating cycles | — |
| Charging | USB-C | USB-C |
| Charge Time | ~1 hour | — |
| Pass-Through Charging | Yes | — |
| Height | 7.75 inches | — |
| Weight | 2.8 oz | — |
| Power Adjustment | Modular - Six Stages | 3 Preset Voltage Settings |
| Chamber Material | Quartz | — |
| Concentrate Support | Yes | Yes |
| Brand | Dr. Dabber | Kandypens |
| Adjustable Airflow | Yes | — |
| Diameter | 2.83 inches | — |
| Release Date | 2020 | — |
| Tip Material | — | Quartz Mesh |
| Warranty | 1 year | Lifetime (battery) |
| Water Filtration | — | Yes |
The biggest practical difference is price tier: the Kandypens Oculus sits at $100 while the Dr. Dabber Boost Evo is $240, a gap of about $140 that puts them in different buying brackets.
Kandypens Oculus is the cheaper option at $100 compared with $240 for the Dr. Dabber Boost Evo, about $140 less. Live retailer pricing can shift, so confirm before buying.
Kandypens Oculus is the take-anywhere choice. It's a portable, battery-powered unit, while the Dr. Dabber Boost Evo is built for home use, where bigger heaters, AC power, and larger chambers make sense.
Both devices support concentrate use, typically via an included or aftermarket pad or insert. Check the manual for the recommended approach for each.
Across the 24 specs we line up, they share 4 and differ on 20, an overlap of about 17%. The differences are concentrated in the areas the spec table highlights with a marker.
Jump into the comparison hub to pick any two devices and open a canonical side-by-side page.