Price (USD)
Arizer Extreme Q edgeArizer Extreme Q
$160
Dr. Dabber Boost Evo
$240
Arizer Extreme Q is typically around $80 lower.
Vaporizer Comparison
Side-by-side specs, pricing context, and clear decision guidance.
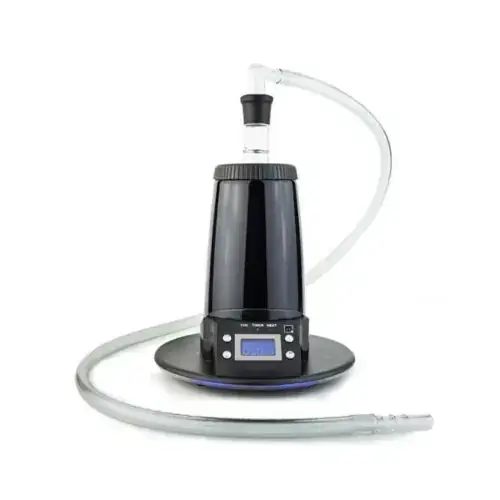
Arizer Extreme Q
Arizer from $199.99
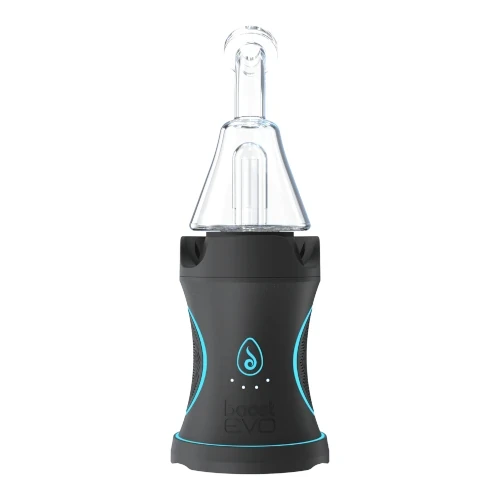
Dr. Dabber Boost Evo
Dr. Dabber from $417.99
Arizer Extreme Q and Dr. Dabber Boost Evo are both desktop / electronic vaporizers, but they target different priorities. Arizer Extreme Q is usually the lower-cost pick at $160, around $80 below Dr. Dabber Boost Evo. Dr. Dabber Boost Evo has the quicker listed heat-up profile, which can matter for shorter sessions.
Specs Compared
25
Different Specs
23
Shared Specs
2
Overall Overlap
8%
Shared Traits
A quick snapshot of the specs people usually care about first.
Arizer Extreme Q
$160
Dr. Dabber Boost Evo
$240
Arizer Extreme Q is typically around $80 lower.
Arizer Extreme Q
~100 seconds
Dr. Dabber Boost Evo
~11 Seconds
Dr. Dabber Boost Evo has the quicker listed heat-up profile.
Arizer Extreme Q
442g
Dr. Dabber Boost Evo
2.8 oz
Dr. Dabber Boost Evo is the lighter listed unit.
Arizer Extreme Q
Convection
Dr. Dabber Boost Evo
Conduction
Heating style differs, which can impact flavor and extraction behavior.
Top specs where these two devices diverge.
Price (USD)
Arizer Extreme Q
$160
Dr. Dabber Boost Evo
$240
Heating Type
Arizer Extreme Q
Convection
Dr. Dabber Boost Evo
Conduction
Heat Up Time
Arizer Extreme Q
~100 seconds
Dr. Dabber Boost Evo
~11 Seconds
Temperature Range
Arizer Extreme Q
50°C-260°C
Dr. Dabber Boost Evo
500-750°F
Battery Type
Arizer Extreme Q
N/A
Dr. Dabber Boost Evo
Internal
Charging
Arizer Extreme Q
N/A
Dr. Dabber Boost Evo
USB-C
Weight
Arizer Extreme Q
442g
Dr. Dabber Boost Evo
2.8 oz
Power Adjustment
Arizer Extreme Q
Digital Control
Dr. Dabber Boost Evo
Modular - Six Stages
Chamber Material
Arizer Extreme Q
Glass
Dr. Dabber Boost Evo
Quartz
Brand
Arizer Extreme Q
Arizer
Dr. Dabber Boost Evo
Dr. Dabber
Current price
$199.99
at Slick Vapes
Current price
$417.99
at Mind Vapes
Prices are read automatically from retailer pages and were last checked Oct 2, 2026; confirm the price at checkout. Some links are affiliate links, which support Thermal Extractions at no extra cost to you.
Direct comparison of every spec from each device profile.
| Specification | Arizer Extreme Q | Dr. Dabber Boost Evo |
|---|---|---|
| Price (USD) | $160 | $240 |
| Device Type | Desktop | Desktop |
| Heating Type | Convection | Conduction |
| Heat Up Time | ~100 seconds | ~11 Seconds |
| Temperature Range | 50°C-260°C | 500-750°F |
| Chamber Capacity | ~0.7g | — |
| Battery Type | N/A | Internal |
| Battery Life | — | 40-60 heating cycles |
| Charging | N/A | USB-C |
| Charge Time | — | ~1 hour |
| Pass-Through Charging | — | Yes |
| Dimensions | 165x165x170mm | — |
| Height | — | 7.75 inches |
| Weight | 442g | 2.8 oz |
| Power Adjustment | Digital Control | Modular - Six Stages |
| Chamber Material | Glass | Quartz |
| Concentrate Support | — | Yes |
| Brand | Arizer | Dr. Dabber |
| Adjustable Airflow | Yes | Yes |
| Country of Manufacture | China | — |
| Diameter | — | 2.83 inches |
| Heating Element | Ceramic | — |
| Release Date | 2010 | 2020 |
| Remote Control | Yes | — |
| Warranty | 3 years | 1 year |
The biggest practical difference is heating approach: Arizer Extreme Q runs convection while Dr. Dabber Boost Evo runs conduction. That changes flavor delivery, vapor density, and how the device responds to slow versus fast draws.
Arizer Extreme Q is the cheaper option at $160 compared with $240 for the Dr. Dabber Boost Evo, about $80 less. Live retailer pricing can shift, so confirm before buying.
Dr. Dabber Boost Evo reaches session-ready temperature in ~11 Seconds, while the Arizer Extreme Q takes ~100 seconds. That's roughly 89 seconds quicker on the Dr. Dabber Boost Evo, which is useful if you want shorter, on-demand sessions.
Arizer Extreme Q uses convection heating, while the Dr. Dabber Boost Evo uses conduction. Heating style influences flavor profile, vapor density, and how forgiving the device is to draw technique.
Dr. Dabber Boost Evo is the lighter unit at 2.8 oz, around 363g less than the Arizer Extreme Q at 442g. The lighter device is easier to carry and pocket day-to-day.
Arizer Extreme Q controls heat with digital control, while the Dr. Dabber Boost Evo uses modular - six stages. Arizer Extreme Q gives you finer per-degree control.
Across the 25 specs we line up, they share 2 and differ on 23, an overlap of about 8%. The differences are concentrated in the areas the spec table highlights with a marker.
Jump into the comparison hub to pick any two devices and open a canonical side-by-side page.